Polkadot buyers were unable to break out of the critical resistance at $7.5, resulting in a significant drop of 7% due to increased selling pressure.
The cryptocurrency has now reached a decisive support level and the upcoming price action will be crucial in determining Polkadot’s future trend.
Technical analysis
By Shayan
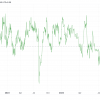
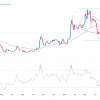
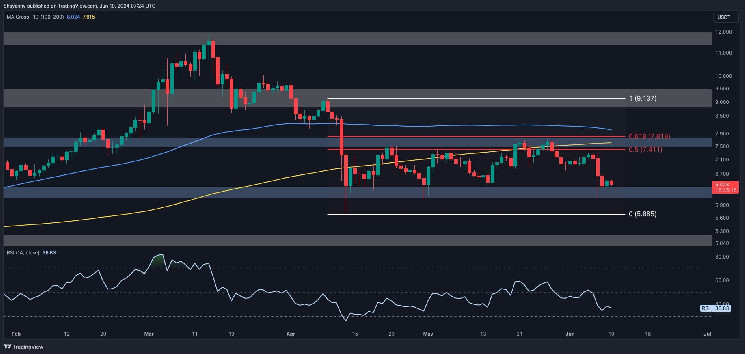
The daily chart
A detailed analysis of the daily chart reveals that Polkadot buyers have failed to recapture a key resistance zone for several weeks. This zone includes the 100-day moving average at $7.6 and the price range between the 0.5 ($7.4) and 0.618 ($7.8) Fibonacci levels. Resistance is accompanied by substantial supply, likely resulting from aggressive short positions in perpetual markets.
This intensified selling activity led to a 7% drop in Polkadot’s price, indicating bearish market sentiment. However, the price reached a crucial support zone near the $6.5 level.
This range is full of demand and could counter the prevailing selling pressure and halt further declines. If this fundamental support is unexpectedly breached, the bearish trend will likely continue in the medium term.
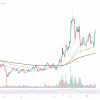
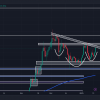
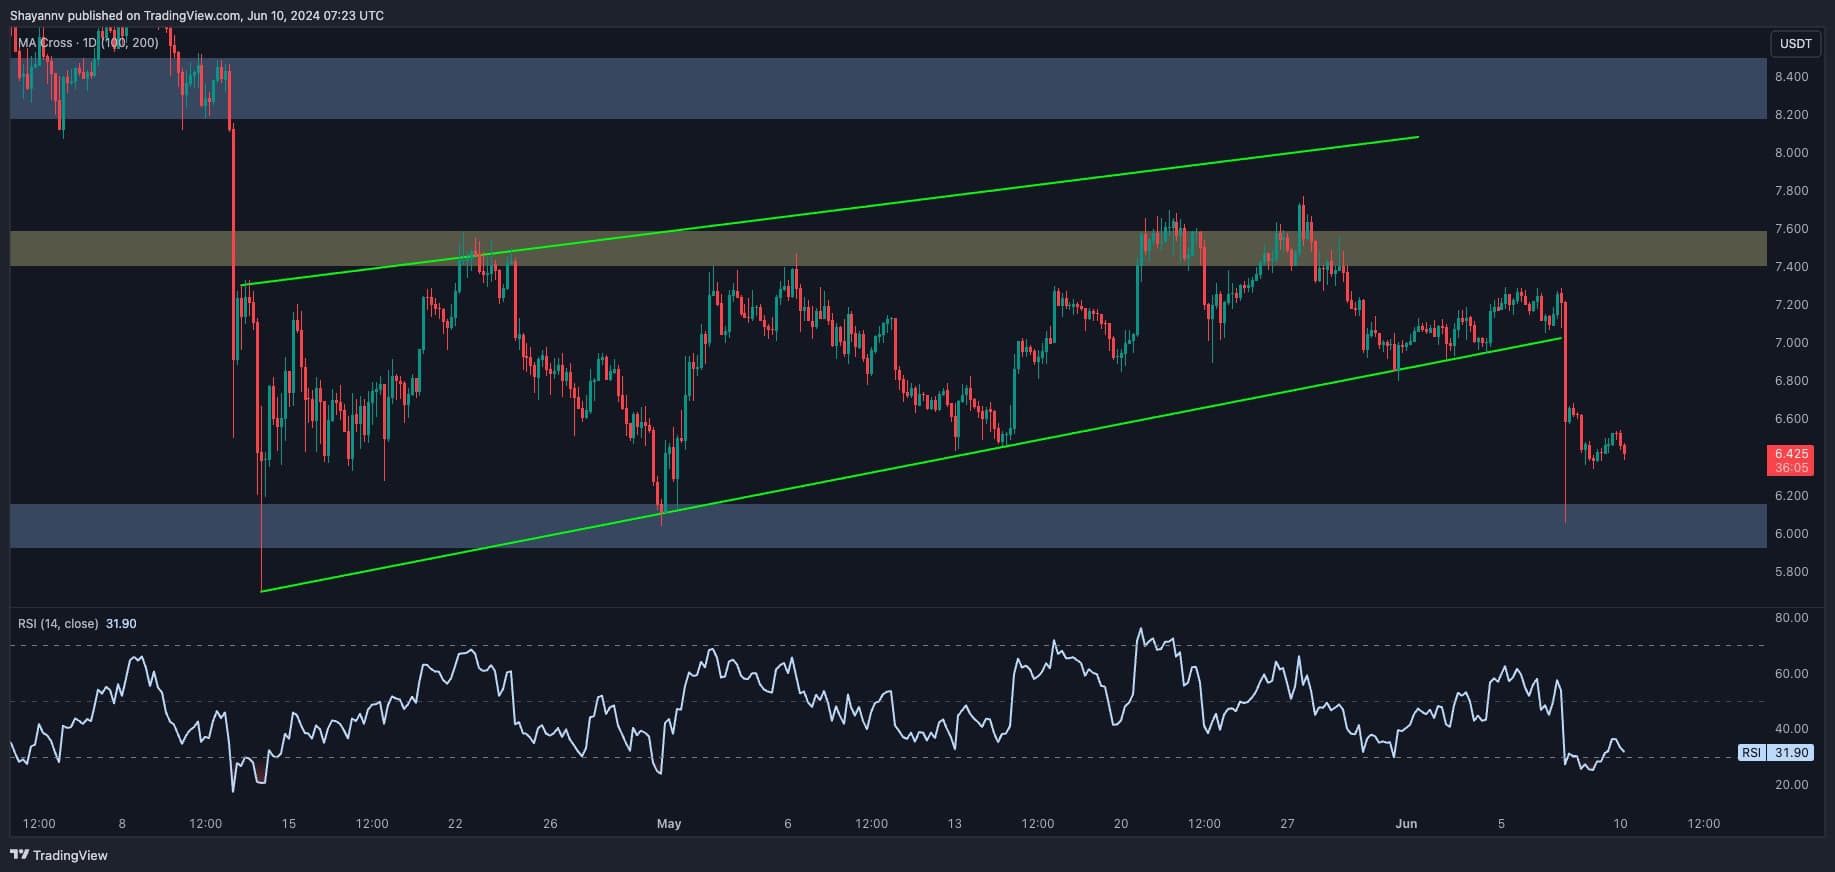
The 4-hour chart
On the 4-hour chart, Polkadot price has formed an ascending wedge pattern during the recent multi-month consolidation phase. After suffering a rejection at the significant resistance level of $7.5, the price fell sharply, breaking through the lower limit of the wedge. This breakout led to the liquidation of numerous long positions, causing a cascading effect towards the $6.5 mark.
The price has now reached a critical support region around the $6.5 level, which includes previous major daily lows. A period of consolidation near this crucial support is likely before the next significant move.
Sentiment analysis
By Shayan
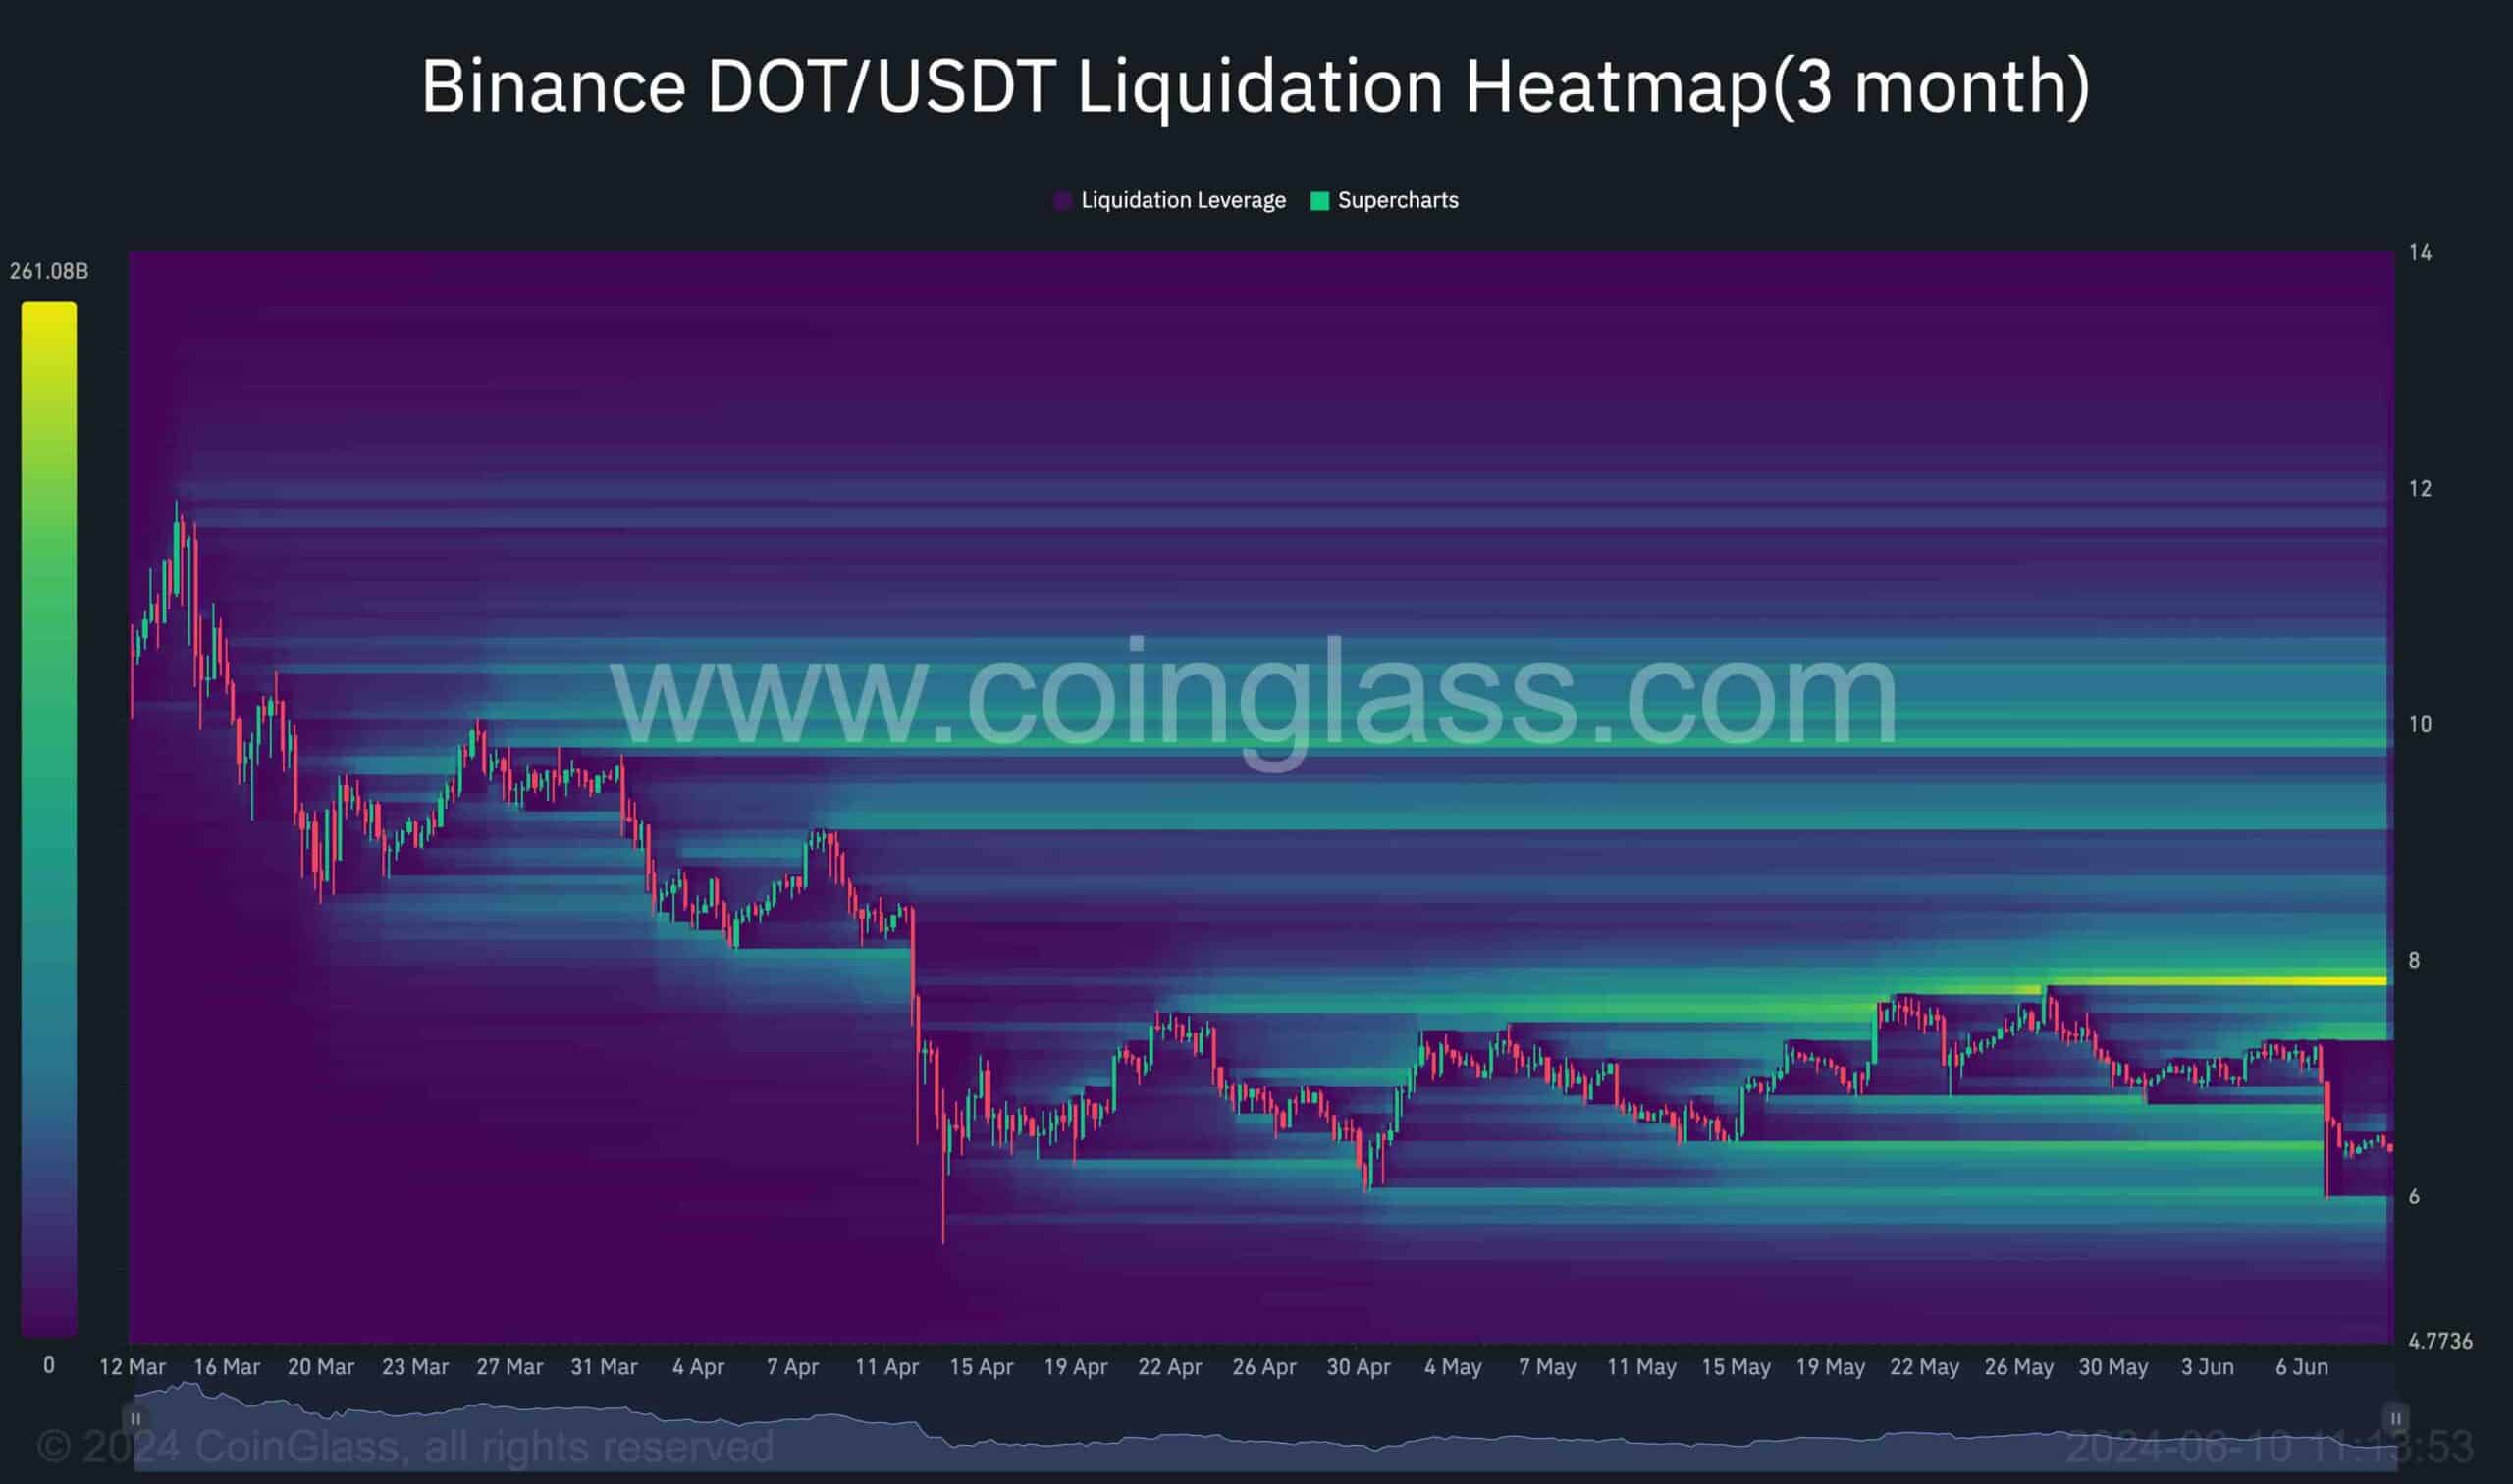
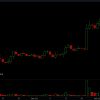
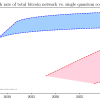
Currently, Polkadot is going through a period of slight consolidation near the $6.5 mark, after suffering a significant decline. Analyzing futures market parameters, especially Binance’s DOT/USDT settlement heat map, offers valuable insights into potential price movements and liquidity pools.
The heat map indicates that due to the recent sharp decline, the price has absorbed significant liquidity, mainly between $6.50 and $6, leading to the liquidation of many long positions. Notably, there are no substantial levels of liquidity below the $6 mark. This typically indicates a cooling-off period in the futures market.
However, there is significant liquidity near the $8 level, suggesting that it could act as a resistance level. Therefore, if a bullish recovery occurs in the medium term, this area will likely be the main target for buyers to recover.