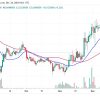
As TradingView data suggests, PEPE has achieved a massive 21% growth in the past few days. The asset has reached the $0.00001 threshold and is now aiming to surpass the all-time high once again. The key factors to look out for will be: moving average support, ascending trend line and momentum indicators such as the RSI.
As TradingView data suggests, PEPE has achieved a massive 21% growth in the past few days. The asset has reached the $0.00001 threshold and is now aiming to surpass the all-time high once again. The key factors to look out for will be: moving average support, ascending trend line and momentum indicators such as the RSI.
The recent rise of PEPE is supported by a strong ascending trend line, which shows a constant upward movement. This trend line has been a solid support level, which has helped PEPE stay on its bullish path. The 50, 100 and 200 EMAs are also rising, providing additional support and reinforcing the positive trend.
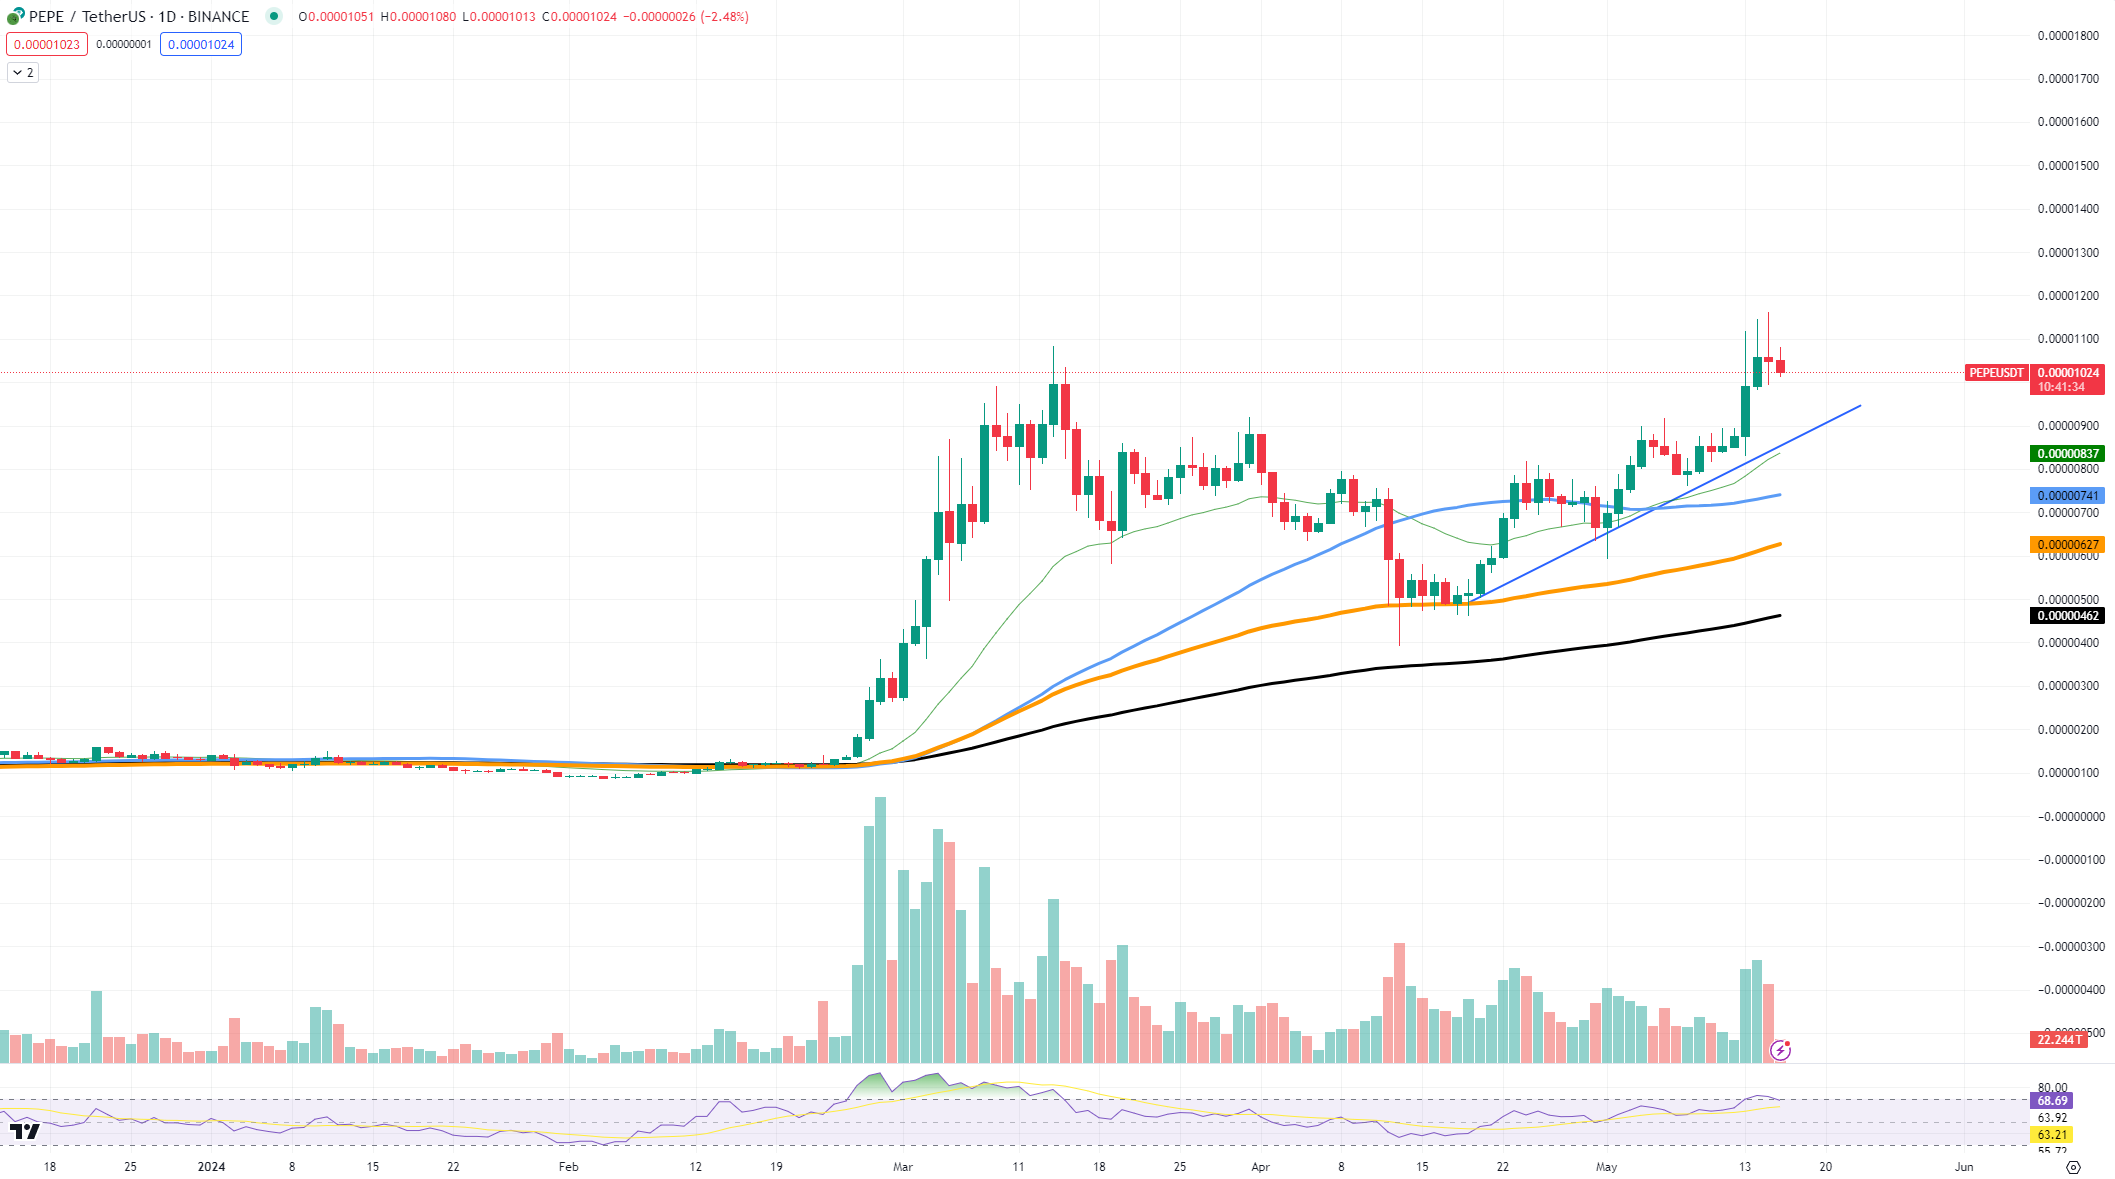
Another important indicator is the RSI. Right now, the RSI is close to the overbought zone, which means PEPE could see some short-term pauses before rising again. As long as the RSI remains above the midline, the uptrend should continue.
Volume is also crucial. The recent increase in volume shows strong buying interest, which is essential to keep the market bullish. Higher volumes generally mean more traders are active and confident. For PEPE to surpass its all-time high, it must maintain these high trading volumes.
The revitalized Shiba Inu
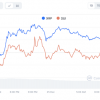
Shiba Inu has faced a fundamental resistance level reflected in the 50 EMA formation. The asset is in active battle mode against it and the latest price action suggests that buyers want to leave it behind. With some room for growth, SHIB needs one more push.
SHIB’s increased volume is a positive factor for the asset’s price, but it is no guarantee of an upcoming price rally. The increase in trading volume may indicate an increase in buying interest among investors, but the overall market recovery remains a key factor for the beloved memecoin.
If SHIB manages to break through, it could signal the start of a more extended upward move.
It is an important moment for Shiba Inu: fighting to break the 50 EMA resistance. The path forward has growth potential, but requires more purchasing power and higher trading volumes to confirm an uptrend. In the event of a breakout, it could signal the start of a longer upward move.
Solana makes her way
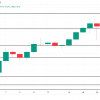
Solana finally broke through a key resistance level and gained a foothold above the 50 EMA. As TradingView data suggests, Solana has reached the price threshold of $160 and even surpassed it. For now, the price needs some bullish conviction to stay afloat and move forward.
Solana faces first resistance around $175, a level that has previously acted as strong resistance. If Solana can overcome this, the next target could be $190, another historic resistance level. On the downside, support is likely around $145, which has previously acted as a price reversal level. If held, it could provide a solid foundation for further bullish movement.
Volume is another important factor. The recent increase in trading volume indicates strong buying interest, which is necessary to sustain the current uptrend. Higher volumes generally mean more market share and trust among traders. For Solana to continue its upward movement, it needs to maintain or even increase this volume.
Additionally, the Relative Strength Index is hovering around the midline, suggesting there is still room to grow before reaching overbought territory. This is a positive sign for further bullish momentum.
Solana’s recent break above the 50 EMA and the $160 mark is a strong sign of potential growth. With increased trading volume and positive RSI indicators, the outlook appears bullish. The resistance levels of $175 and $190 need to be monitored. Volume is also crucial, we need it to ensure the continuation of the uptrend. If Solana can maintain this momentum, it could be on its way to even higher price levels.
