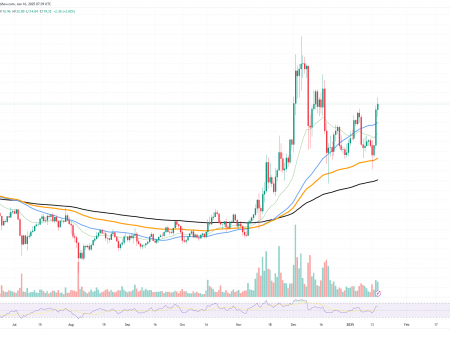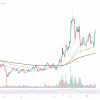
Solana shows signs of preparing for a possible advance above the price of $160. The fact that the aforementioned price level coincides with the 50 EMA makes it a little more important for the price.
Solana shows signs of preparing for a possible advance above the price of $160. The fact that the aforementioned price level coincides with the 50 EMA makes it a little more important for the price.
Solana faces the 50-day EMA at around $160, a key resistance level in technical analysis. This EMA serves as an indicator of medium-term market trends and has historically acted as a solid resistance or support level depending on the direction of the market. For Solana, conquering this mark could indicate strong bullish sentiment and potentially usher in higher price levels.
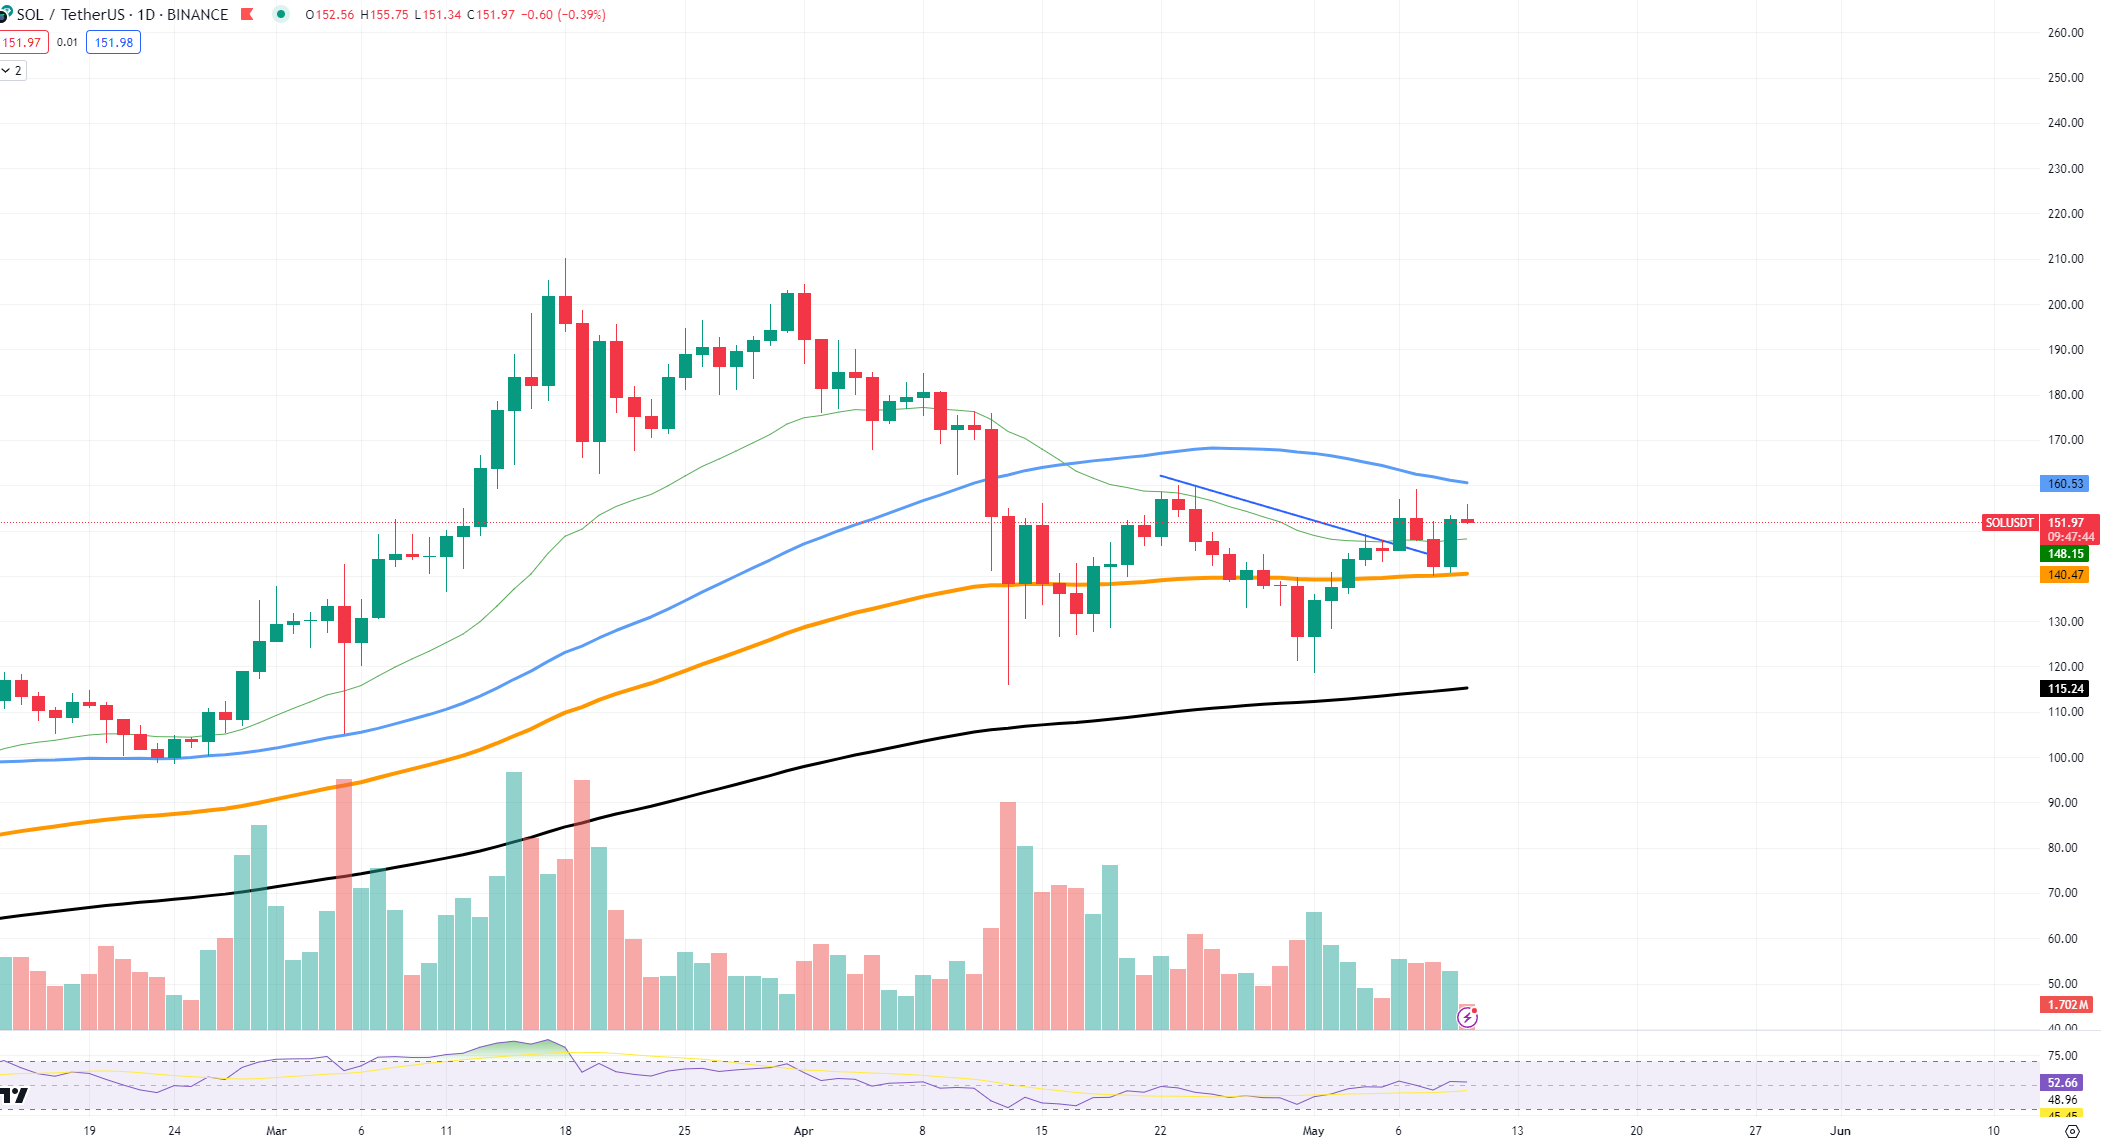
However, the path to breaking this resistance is challenged by falling trading volume. Typically, a decrease in volume can indicate a lack of conviction in the direction of the market, suggesting that traders are cautious and potentially waiting for more definitive signals before committing to larger positions. This could mean that Solana’s approach to $160 will require a significant market catalyst or event to boost sentiment and trading activity.
Another technical aspect to take into account is the possible breakout of the “neckline” at around $160. This term refers to a key level in chart patterns such as head and shoulders or inverse head and shoulders that, when broken, can cause significant price movements. A decisive close above this level could validate bullish predictions and trigger a new wave of buying interest.
Will Ethereum do it?
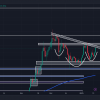
Currently, Ethereum cannot surpass the 100 EMA threshold. A key observation is its inability to break above the 100-day EMA, a technical indicator that often acts as a measure of the asset’s medium-term trend.
Currently trading below $3,100, Ethereum is struggling to establish a clear uptrend. This price is crucial because staying below this level introduces considerable risks to Ethereum’s valuation. A sustained position below the 100 EMA not only highlights the market’s bearish trend but also sets up a potential scenario where Ethereum could test the 50 EMA.
The possible move towards the 50 EMA is essential. This indicator is usually seen as an indicator of a short-term trend. A drop towards this level could reinforce the bearish outlook, suggesting that lower prices may be a matter of time.
Cardano resistance
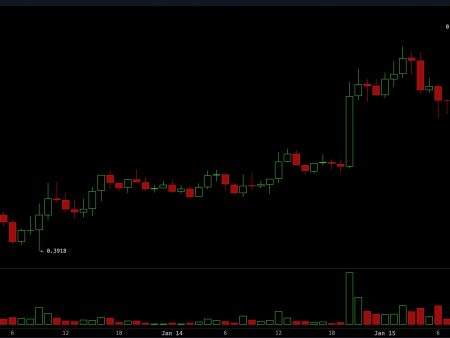
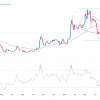
Cardano is facing an important moment on the chart, facing a significant resistance level at $0.46. This resistance has acted as a formidable barrier, preventing the price from rising further in recent weeks. However, the latest trading activity indicates that a potential breakthrough could be on the horizon.
The $0.46 resistance level is not just a random figure; It has been tested several times in recent months, making it a key focal point for traders. Every time ADA approaches this level, selling pressure increases, causing the price to drop again. However, current market dynamics suggest that a change could be afoot.
A recent increase in trading volume has been observed as ADA once again approaches this critical resistance level. Higher volume usually indicates increased interest from traders and can often precede major price movements. If the buyers manage to dominate the sellers, we could witness ADA breaking this resistance level.
Additionally, the Relative Strength Index shows that ADA is moving towards a neutral point, with a current reading close to 50. This suggests that selling pressure is decreasing and buying interest is increasing, providing balanced strength. which could lean in favor of the bulls.
The RSI move towards a midline of 50 is particularly significant because it implies that market sentiment is changing from bearish to potentially bullish. If the RSI continues to rise and remains stable, it supports the scenario of strengthening bullish momentum.
A successful breakout of the $0.46 resistance could open the doors to further gains, possibly testing higher resistance levels. On the other hand, failing to make a breakthrough could lead to consolidation or a pullback to lower support levels.
