A critical look at on-chain metrics provides new insights that suggest a possible strong recovery on the horizon for Bitcoin, following the drop below $60,000. Swissblock’s “Bitcoin Fundamental Index,” which is a composite measure of various Bitcoin network health indicators, recently reached what appears to be an inflection point, indicating a potential upward move for Bitcoin. price.
A critical look at on-chain metrics provides new insights that suggest a possible strong recovery on the horizon for Bitcoin, following the drop below $60,000. Swissblock’s “Bitcoin Fundamental Index,” which is a composite measure of various Bitcoin network health indicators, recently reached what appears to be an inflection point, indicating a potential upward move for Bitcoin. price.
One of the key metrics to consider is the short-term holder’s MVRV (market value to realized value), which currently stands at 0.96. This ratio essentially compares the market value (the current price at which Bitcoin is trading) with the realized value (the average price at which the coins last moved). A value less than one typically indicates that short-term holders are holding coins at a loss, which may indicate a possible bottom if other conditions align.
When STH-MVRV has fallen below one, it has typically been a precursor to a market rally as it suggests that selling pressure from short-term holders is easing and could indicate that sellers are exhausted. This exhaustion is further supported by the recent performance of the Bitcoin fundamental index, which shows a recovery from lower levels, suggesting further network growth and investor confidence.
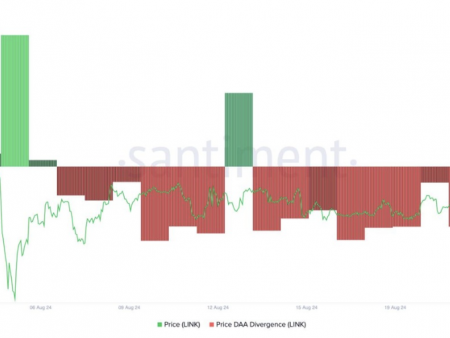
Looking at the “Bitcoin Fundamental Index” chart, there have been significant spikes in the index that correlate closely with increases in the price of Bitcoin. The index itself measures various aspects of network health, including transaction volume, wallet activity, and other undisclosed proprietary indicators that aim to measure the overall sentiment and fundamental strength of Bitcoin.
The current value of the index is approaching the upper end of its recent range. Historically, these patterns have indicated strong bullish sentiment, especially when combined with a low STH-MVRV.