Solana has broken through a critical resistance level, marking a possible trend reversal for the cryptocurrency. The chart indicates a significant breakout of the upper trendline resistance, establishing a new movement scenario for the asset.
Solana has broken through a critical resistance level, marking a possible trend reversal for the cryptocurrency. The chart indicates a significant breakout of the upper trendline resistance, establishing a new movement scenario for the asset.
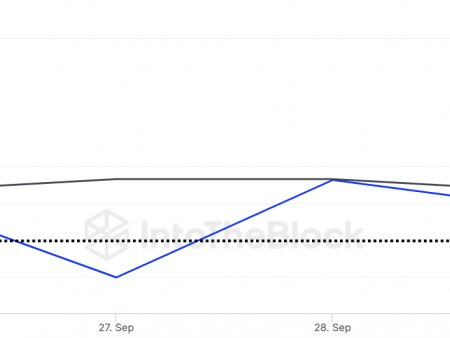
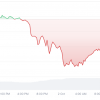
Solana has shown notable price performance, as evidenced by its latest rally beyond the upper trend line of its ascending channel. This advance is a classic technical confirmation of bullish sentiment and suggests the possibility of a sustained upward trajectory. With SOL price surpassing the $130 mark, the cryptocurrency has not only defied immediate resistance but has set the stage to test new highs.
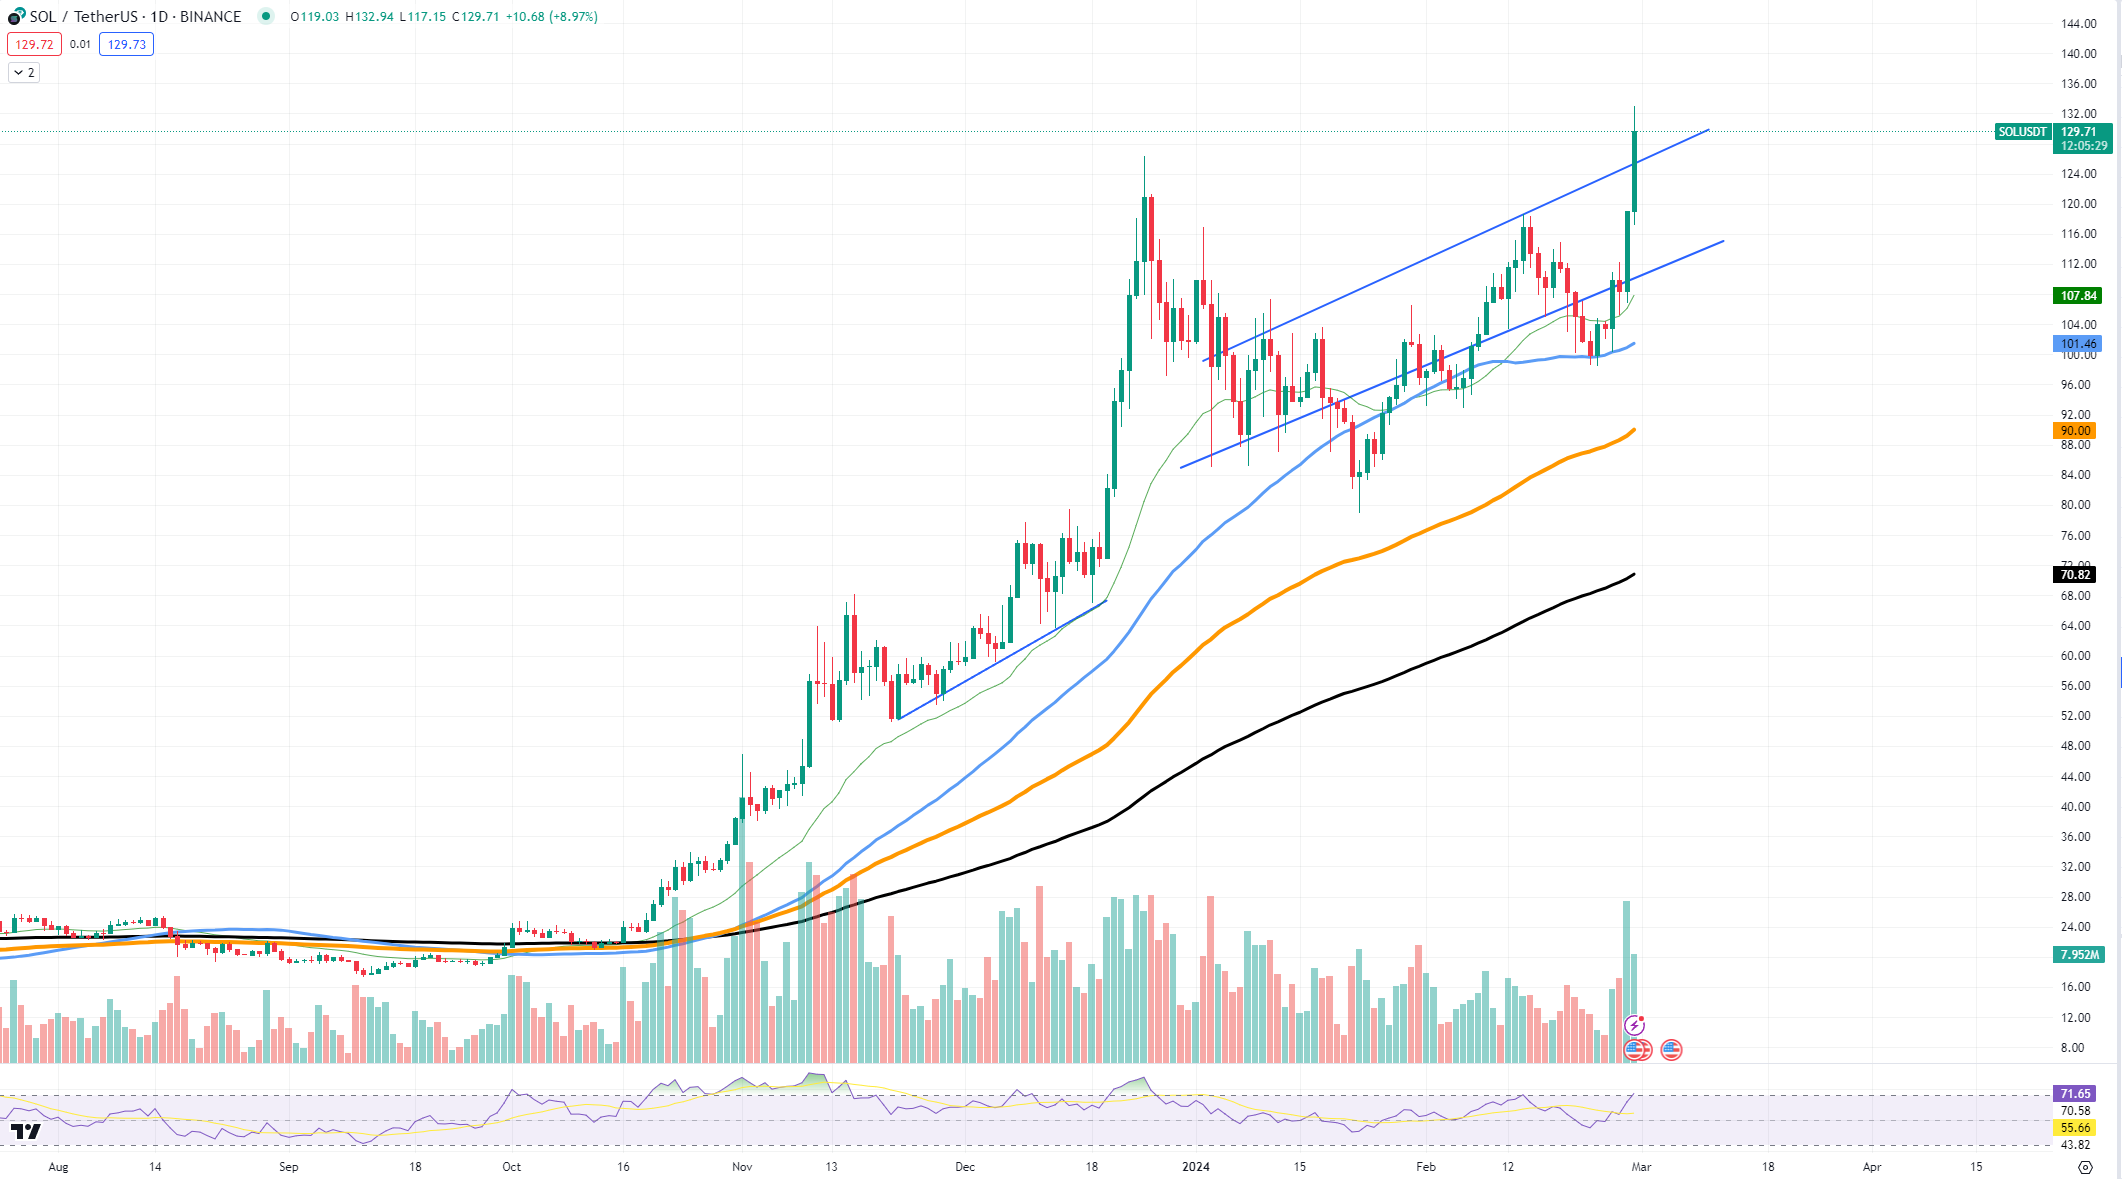
Looking at the support levels, Solana price sits comfortably above the 50-day (orange line) and 100-day (blue line) moving averages, which have historically acted as dynamic support in uptrends.
The immediate support level is now hovering around the $107 mark, which coincides with the previous resistance-turned-support trend line. The strong volume that accompanied the breakout adds credibility to the bullish outlook, indicating strong buyer interest.
On the contrary, the next resistance level to watch is near the $140 zone, where profit-taking and round psychological figures can temporarily halt the rally.
Ethereum seems unstoppable
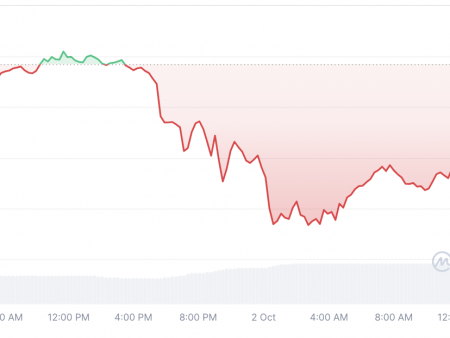
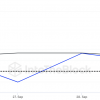
Ethereum continues its meteoric rise and is currently showing a price surge that has left investors and enthusiasts in a state of euphoria. However, in the midst of the celebration, if you look closely at the chart, there are signs of a possible bearish reversal, justifying a closer analysis of the extraordinary rally of the second largest cryptocurrency.
Ethereum’s rally has been nothing short of spectacular, with prices breaking through resistance levels with apparent ease. In recent trading sessions, ETH is hovering above $3,500, but this unstoppable rally may make investors question the sustainability of such growth.
If a reversal were to occur, the focus would be on potential support levels that could cushion Ethereum’s decline. The $2,695 mark emerges as a critical juncture, aligning with the 50-day moving average, a dynamic level that historically serves as a battleground between bulls and bears. A break below this level could see Ethereum test the support at $2,065, near the 100-day moving average, which may provide a stronger foundation for the digital asset.
The current trend indicates that while the market is enjoying a wave of optimism, caution is advised. Ethereum has defied traditional market expectations, but no asset is immune to corrections. The foreseeable future suggests that if traders start locking in profits, a bearish scenario could develop, triggering a sell-off towards the identified support zones.
Bitcoin Strength Is Increasing
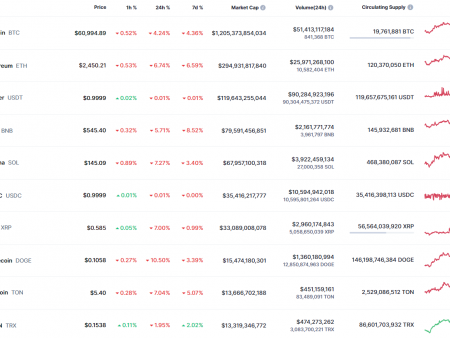
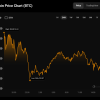
The flagship cryptocurrency, Bitcoin (BTC), is putting up a formidable show of strength in the market, with its price trajectory pointing sharply upwards. As the market rides a wave of euphoria, the question on many investors’ minds is whether Bitcoin is poised to hit new all-time highs in the near future.
The price of Bitcoin has been rising relentlessly and the latest candles on the chart reflect significant buyer confidence. Currently, the price has broken through the $60,000 resistance level, a major psychological barrier that could now serve as a platform for further gains. The sharp rise is accompanied by a substantial increase in trading volume, indicating strong conviction behind the move.
The moving averages (50, 100 and 200 days) are aligned in ascending order, which is a classic bullish signal. These lines are likely to act as dynamic support levels in the event of a price pullback. The 50-day moving average, in particular, has been reliable support during the recent rally, suggesting that bullish investors could view any dip as a buying opportunity.
As of now, the RSI is trending towards overbought territory, suggesting that Bitcoin is extending into an area where a reversal could occur. However, during strong trends, assets can remain overbought for extended periods, defying traditional expectations of an immediate pullback.