For the past 30 days, tokens with artificial intelligence (AI) and big data fundamentals have been on traders’ radar. But not many market participants keep tabs on developments within each ecosystem.
According to on-chain crypto tool “Santiment”, five major AI-themed projects with high development activity include NEAR Protocol (NEAR), Oasis Protocol (ROSE), Golem (GLM), Oraichain (ORAI), and Ocean Protocol ( OCEAN).
🧑💻 Here are the top #AI and #BigData crypto coins, sorted by notable daily development activity rates over the past 30 days:
1 @NEARProtocol $NEAR
2 @OasisProtocol $ROSE
3 @golemproject $GLM
4 @oraichain $ORAI
5 @oceanprotocol $OCEAN
6 @iEx_ec $RLC
7 @graphprotocol $GRT
8… pic.twitter.com/cTpDdjVblL— Santiment (@santimentfeed) March 15, 2024
For those who aren’t familiar, development activity tracks a project’s public GitHub activity. When the metric decreases, it means that developers are not deploying many features on the network.
However, the increased development activity of the above projects means that more brain power is focused on them as developers believe they would be successful. Typically, this is a bullish sign. However, it is also important to consider how their prices perform and what potential they have.
NEAR (NEAR) protocol
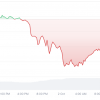
NEAR recently hit a high of $9 on March 14. But the 4-hour chart showed that traders started taking profits at that level. As a result, the bulls were unable to defend the support at $7.77. At the time of this writing, NEAR’s price was $7.57, indicating that selling pressure had reduced.
However, bulls need to watch out for the immediate support at $7.05. If NEAR closes below this area, the price could slide to $6.65. On the other hand, a break above this point could send the token back in the direction of $9.
Interestingly, the Supertrend indicator revealed that a buy signal was at immediate support. Therefore, if the price of NEAR drops to $7.05, entries into the region could be profitable as the token could rebound to the $9 region.
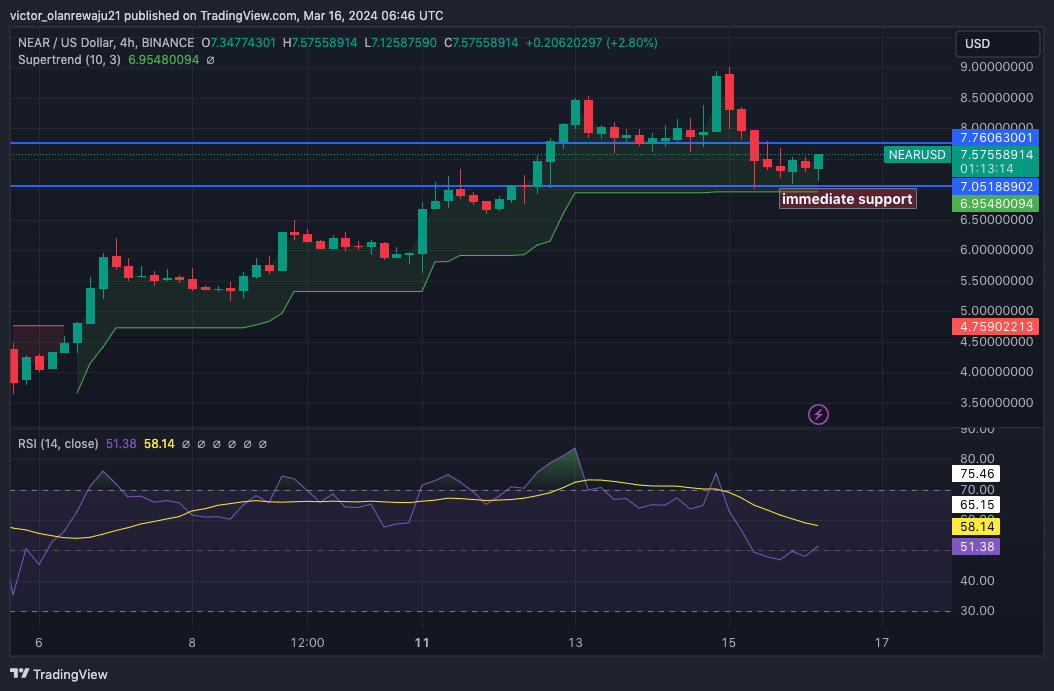
4-hour chart NEAR/USD (Source: TradingView)
Furthermore, the Relative Strength Index (RSI) fell below the midpoint, suggesting bearish momentum. If the RSI reading breaks above 50,000, NEAR price may rebound before reaching $7.05. But waning momentum could push the value lower before a rally returns.
Oasis Protocol (ROSE)
The sequential Tom DeMark (TD) on the 4-hour chart ROSE/USD indicated a buy signal. This technical analysis indicator identifies the exact moment of trend exhaustion and potential price reversals.
Between March 12 and March 15 there were approximately nine red candlesticks indicating the dominance of the sellers. However, data at press time revealed that bulls capitalized on the fatigue and built support at $0.154.
As it stands, ROSE looked set to break out of the $0.167 upper resistance. At the time of writing, the Awesome Oscillator (AO) was negative, suggesting growing bearish momentum. But the AO flashed green with histogram bars, indicating that a bullish trend reversal was on the cards.
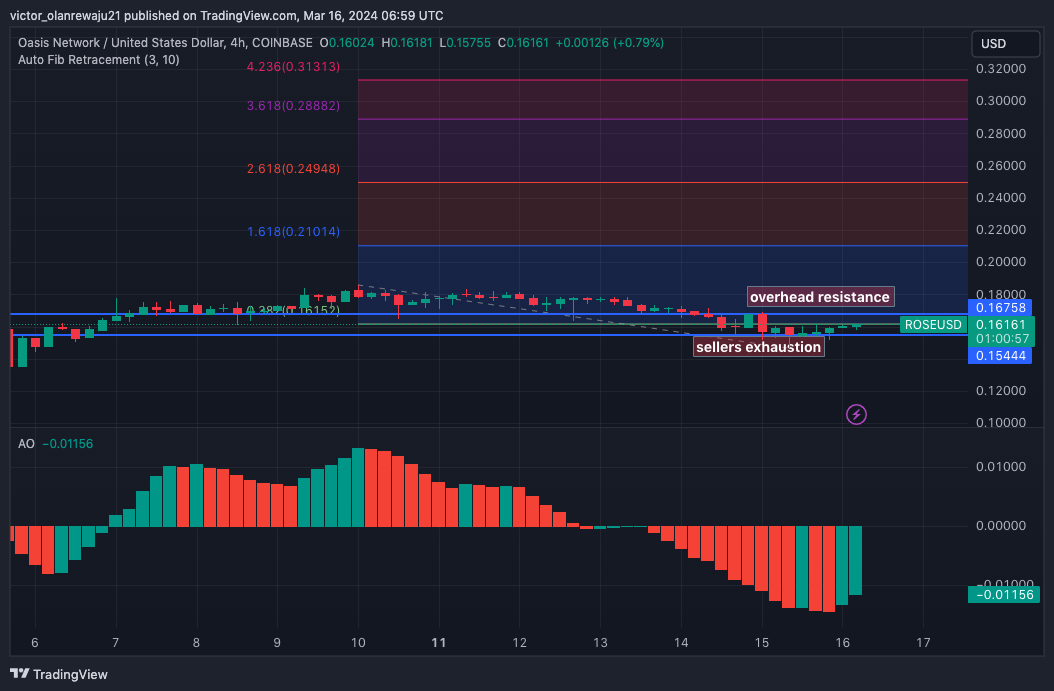
PINK/USD 4-hour chart (Source: TradingView)
If the bullish momentum continues, Fibonacci extension revealed that ROSE price could rise exponentially. In a highly bullish scenario, ROSE could move closer to $0.32
Golem (GLM)
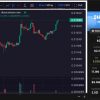
From a technical point of view, the Bollinger Bands (BB) on the 4-hour GLM/USD showed that the token was oversold. This is due to the fact that the lower band of the BB recorded a GLM at $0.54.
Being oversold means the cryptocurrency’s price can bounce north as the BB supports it. At the time of writing, the BB indicated high volatility and showed that the token could extend towards $0.67 in the short term.
But the potential recovery may take some time as the Moving Average Convergence Divergence (MACD) was negative. A negative MACD implies that sellers have overwhelmed buyers. Therefore the price could trend downwards.
In a highly bearish case, GLM price could drop to $0.51. If this were to happen, buying pressure could fuel the rise that could take the token as high as $0.80.
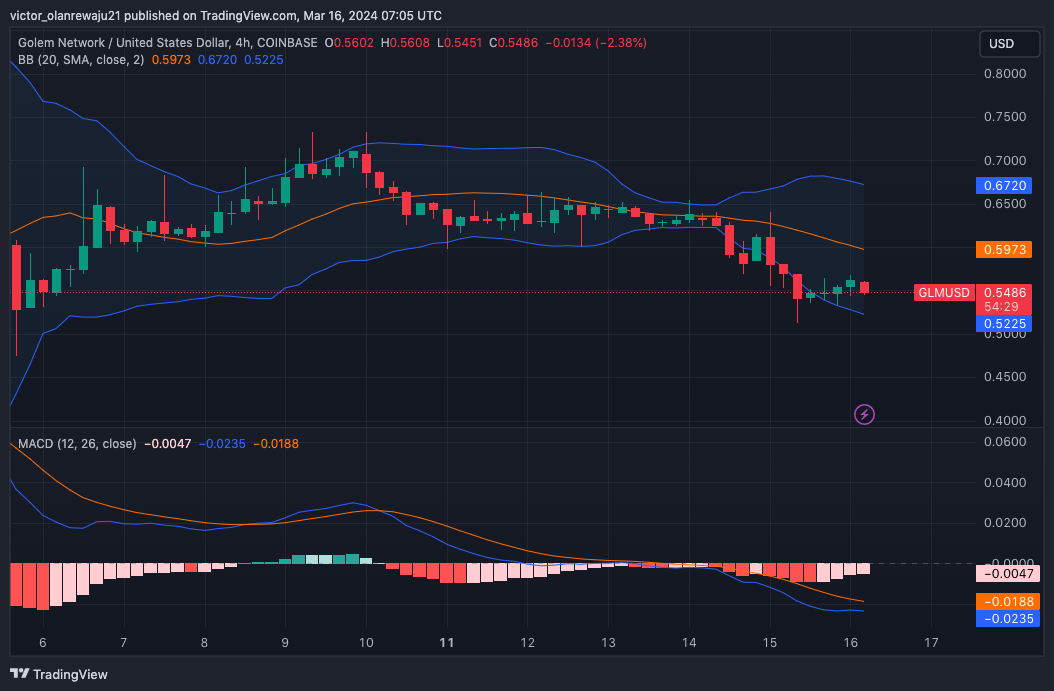
GLM/USD 4-hour chart (Source: TradingView)
Orai Chain (ORAI)
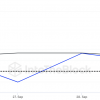
ORAI price increased by 143.57% in the last 30 days. However, this upward momentum was halted by profit taking. As of this writing, the token changed hands at $17.40.
Coin Edition then looked at the Exponential Moving Average (EMA). At the time of writing, there was almost no divergence between the 20 EMA (blue) and 50 EMA (yellow). This indicates that ORAI may consolidate in the near term.
At the same time, the bulls seemed poised to take the token above the EMAs. If this succeeds, a bullish thesis could be confirmed and ORAI could see an increase of 18.33% which could take it to $20.56.
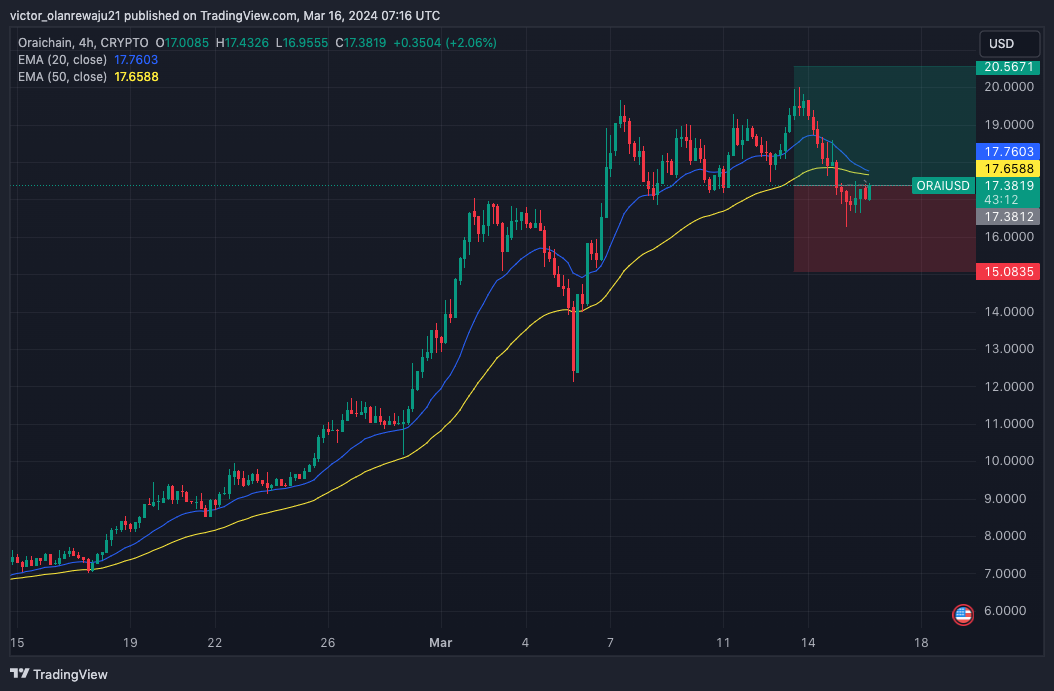
ORAI/USD 4-hour chart (Source: TradingView)
Ocean Protocol (OCEAN)
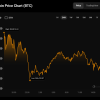
As of this writing, bears have reported OCEAN’s price back to $1.11. The 4-hour analysis also showed evidence of intense selling pressure as red candles dominated that chart.
However, OCEAN could be on the verge of an upside return, according to indications from the Money Flow Index (MFI). At the time of writing, the MFI value was 23.56, meaning the token has experienced a large capital outflow.
If the MFI drops to 20.00, OCEAN could be labeled as oversold. If buying pressure also arrives at this time, the token’s value could retest $1.40.
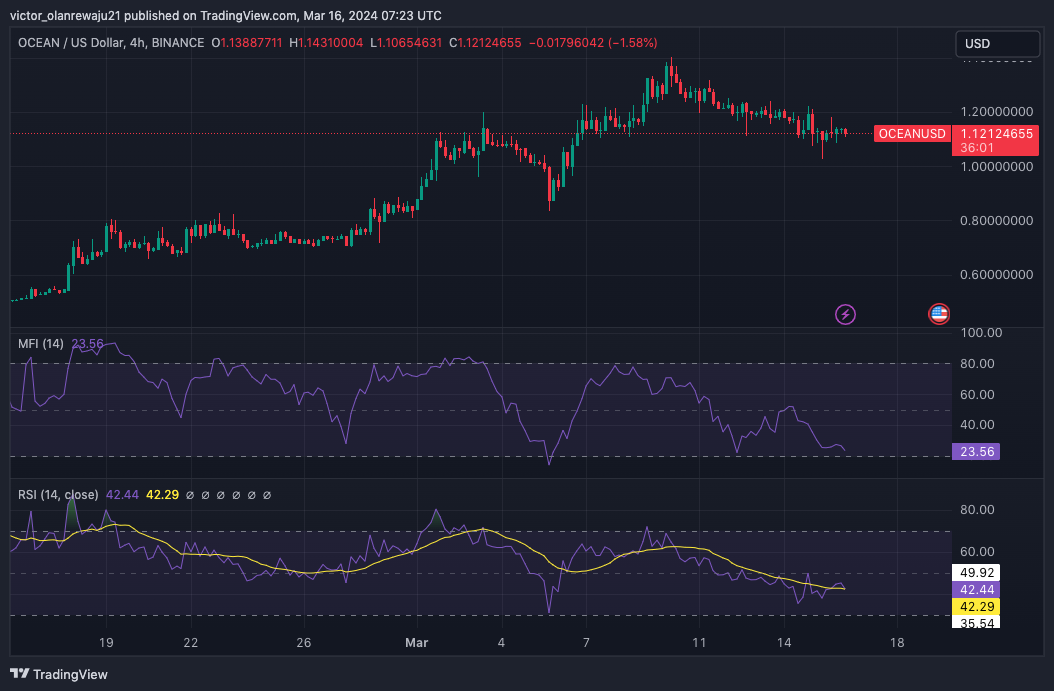
OCEAN/USD 4-hour chart (Source: TradingView)
Like the MFI, the RSI also showed weak buying momentum, suggesting that the OCEAN may fall below $1 before recovering.
Disclaimer: The information presented in this article is for informational and educational purposes only. The article does not constitute financial advice or advice of any kind. Coin Edition is not responsible for any losses incurred as a result of using any content, products or services mentioned. Readers are advised to exercise caution before taking any action regarding the company.