Solana (SOL) price has improved but remains trapped between moving average lines. Cryptocurrency price analysis provided by Coinidol.com.
Solana Long Term Price Forecast: Bearish
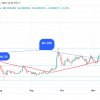
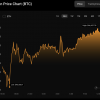
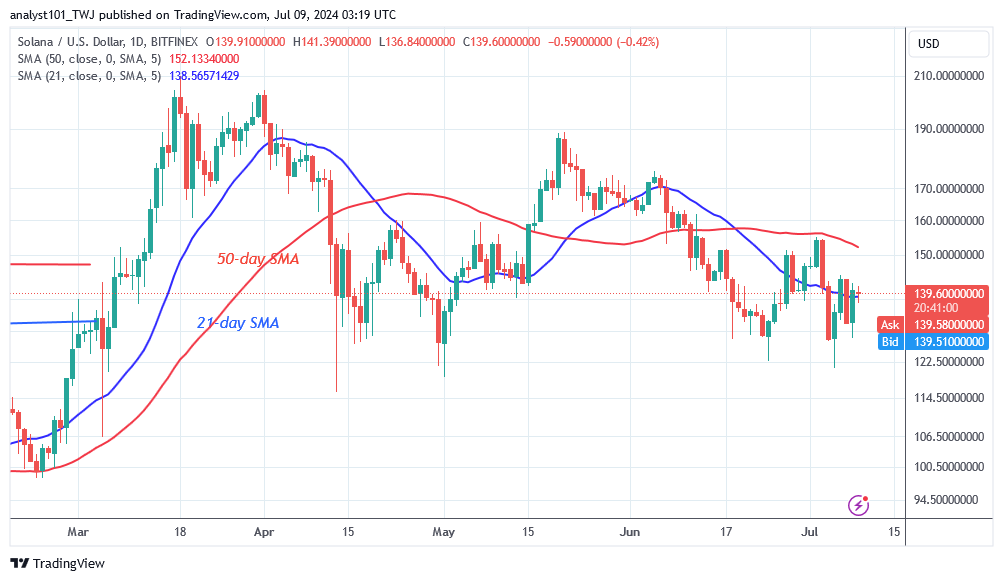
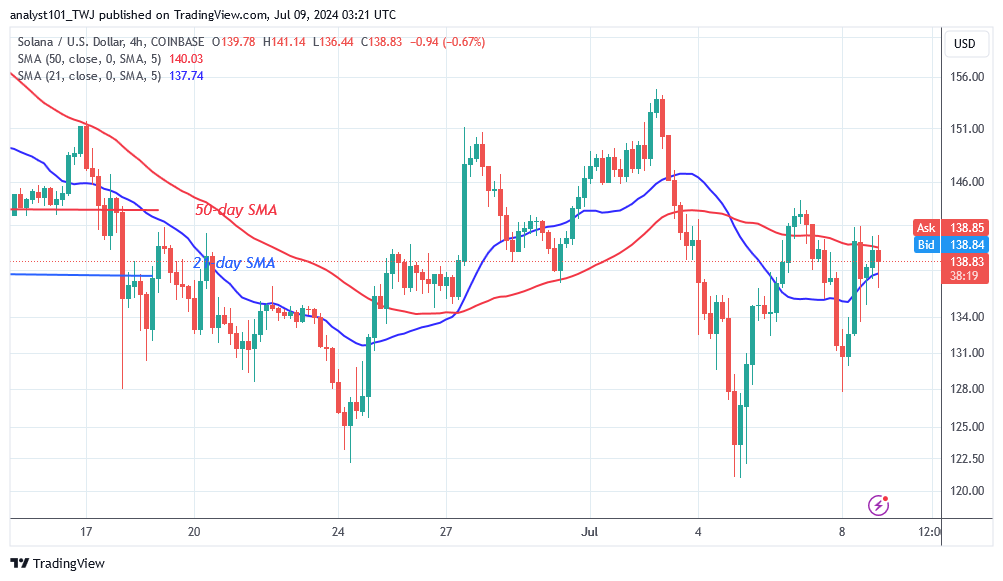
The cryptocurrency has been struggling between the moving average lines to resume the trend. Since June 27, the altcoin price has been fluctuating between $130 and $150. On July 3, buyers tried to hold the price above the 50-day SMA but failed to do so. Solana hit a low of $127 and then recovered. The altcoin is trading above the 21-day SMA support but below the 50-day SMA resistance. The cryptocurrency price will remain in the range for a few more days. Solana will resume its uptrend once it breaks the 50-day SMA. It is currently trading at $141.
Solana Price Indicator Analysis
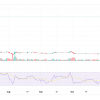
Solana price bars returned to the moving average lines. The move higher met resistance at the 50-day SMA or the $155 high. The moving average lines remained horizontal during the sideways trend.
Technical indicators
Key supply zones: $200, $220, $240
Key demand zones: $120, $100, $80
What are Solana’s next steps?
Solana continues to be in an upward correction and is growing between the moving average lines. On the daily chart, the cryptocurrency price crossed the 21-day simple moving average twice, but failed to hold above the 50-day simple moving average. Solana is growing today and is reaching the resistance level of $155. A breakout above the resistance level will push the altcoin to the high of $188, otherwise, the range movement between the moving average lines will continue.
Disclaimer: This analysis and forecast are the personal opinions of the author. They are not a recommendation to buy or sell cryptocurrency and should not be considered an endorsement by CoinIdol.com. Readers should do their own research before investing in funds.
