- According to an official statement, Binance removed more than 1.64 million BNB from circulation on Monday morning.
- According to network data, BNB’s dominance and volume on social media recovered on Tuesday.
- BNB is hovering around $585, waiting for a catalyst to break key resistance at $664.
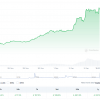
Binance Coin (BNB) price has remained virtually unchanged over the past month. TradingView data shows BNB price at $585 at the time of writing. On-chain metrics support the BNB rally thesis as social dominance and volume have been rising this week.
Binance Burns $963 Million in BNB Tokens
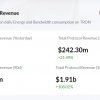
The world’s largest exchange by volume announced on Monday, July 22, that it would burn 1,643,698.80 BNB tokens worth more than $963 million. The burned BNB tokens are permanently removed from circulation, reducing the asset’s supply and selling pressure.
The exchange’s official announcement confirmed that the burn was the 28th quarterly token burn event, and at the time of the burn, the approximate value was $971 million.

Binance BNB Burn.
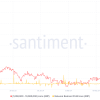
Typically, a reduction in the number of an asset’s tokens in circulation has a net positive effect on the price. However, the recent burn failed to catalyze BNB’s gains. At the time of writing, BNB is trading around $585. Data from Santiment shows that two on-chain metrics have increased this week: social dominance and volume.
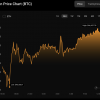
Social dominance measures mentions of a token among market participants on social media platforms. BNB’s social dominance is close to 1% on Tuesday. Volume has increased from 1.58 billion on July 20 to 2.01 billion on July 23, as shown in the Santiment chart below.
Two on-chain metrics support the BNB price recovery thesis.

Social Dominance and Volume
BNB Price Could Revert to 2024 Peak of $721.80
Binance Coin (BNB) is trading around $585 at the time of writing. Binance Coin is likely to extend its gains by 24% and return to the 2024 peak of $721.80 seen earlier on June 6.
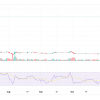
Binance’s native token may face resistance at $588, $664, and $677, which are the 50% and 78.6% Fibonacci retracements of the decline from the June 6 high of $721 to the July 5 low of $454, as well as the upper bound of the fair value gap (FVG), respectively.
The momentum indicator, Moving Average Convergence Divergence (MACD), supports the recovery of BNB, indicating positive underlying price dynamics for Binance Coin.

BNB/USDT Daily Chart
BNB may find support at the July 16 low of $554 and $517.80, the 23.60% Fibonacci retracement level of the aforementioned decline.
