Since Bitcoin (BTC) hit its all-time high of over $73,000 in early 2024, most market participants believe that $100,000 is the next ideal target.
In this context, the analysis of a crypto trading expert TradingShot proposed a version of how historical patterns determine the time frame for Bitcoin’s path to the $100,000 mark.
Analysis published on TradeView On July 3, he emphasized the importance of long-term time frames and historical Bitcoin cycles, which show repeating patterns with changes dependent on current market conditions.
According to the expert, Bitcoin price has been consolidating for the past four months, remaining above the weekly moving average 50 (MA50). This is consistent with the post-halving price action seen in previous cycles, which usually precedes a parabolic rally.
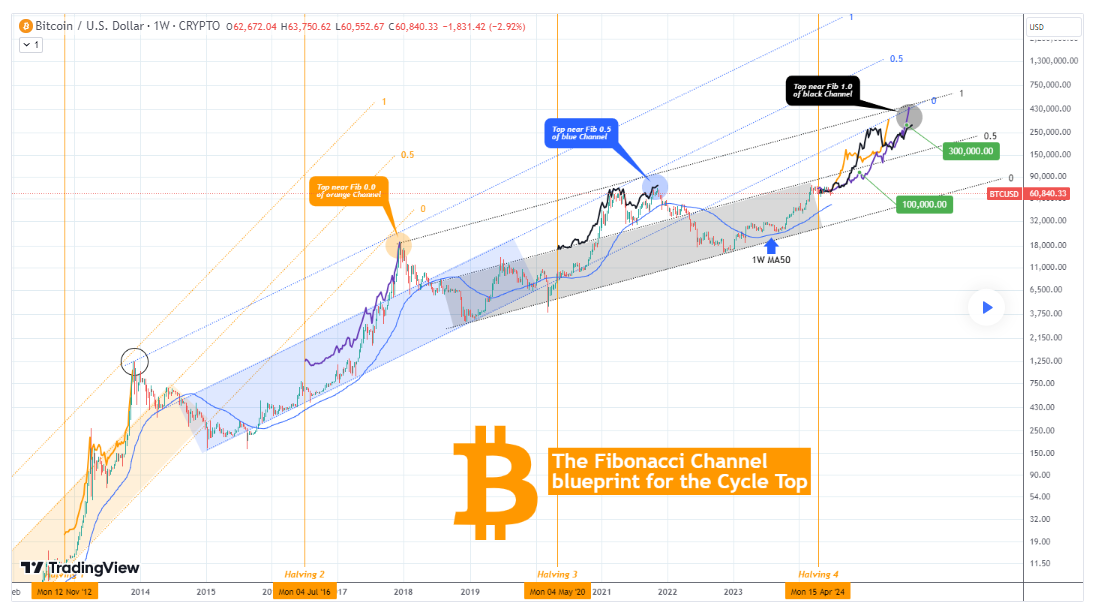
In predicting the price cycle, the analyst noted that historically, Bitcoin cycle tops have closely aligned with Fibonacci trend lines from previous cycle channels. For example, the December 2017 cycle top was just below the Fibonacci channel bottom, while the November 2021 top was just below the Fibonacci channel average.
If this pattern continues with a +0.5 Fibonacci progression, the current cycle top could be just below the top of the Fibonacci channel that starts from the December 2018 bottom.
Bitcoin’s Path to $100,000
The analysis showed that the 1.0 Fibonacci level is just under $300,000. Given Bitcoin’s tendency to grow aggressively after the halving, the current bull cycle is predicted to top at least $300,000.
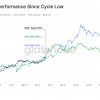
TradingShot identified the 2016-2017 cycle as the most similar to the current one, comparing the post-halving rallies of the previous three cycles to the current channel. If the price of Bitcoin follows this pattern, it is expected to reach $100,000 by December 2024 and possibly $300,000 by August 2025. These milestones could be reached even earlier if Bitcoin shifts to a more aggressive cycle pattern.
“If Bitcoin follows the price action within the Fibonacci channel, it should reach $100,000 by December 2024 and $300,000 by August 2025. If it instead moves to more aggressive cycle patterns, it could reach these levels much sooner,” the expert noted.
Indeed, the analysis comes after Bitcoin’s attempt to claim $65,000 failed again, with the top cryptocurrency losing support at $61,000. Notably, despite this short-term correction, the prevailing consensus suggests that Bitcoin has the potential to rise in the coming months.
For example, banking giant Standard Chartered predicted that Bitcoin would hit a new record in August. The bank’s experts noted that Bitcoin would likely rise to $100,000 on Election Day.
Bitcoin Price Analysis
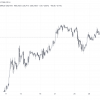
At press time, Bitcoin was trading at $60,166, reflecting a correction of more than 3% in the last 24 hours. Bitcoin remains more than 5% below its weekly high above $65,000.
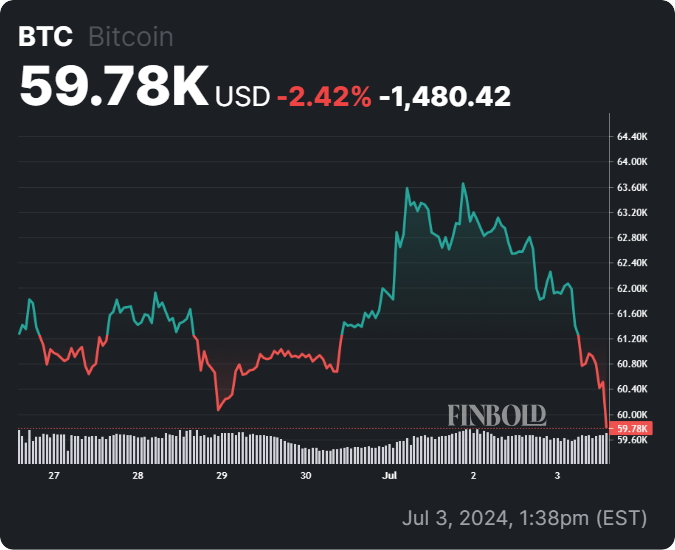
At the same time, Bitcoin is showing strong resistance at $63,000 and support near $60,000. Monitoring these levels will be crucial to predicting the next price moves. If the price breaks the resistance, it could indicate a bullish trend. Conversely, if it falls below the support, it could signal further declines.
Denial of responsibility: The content of this website should not be considered investment advice. Investing is speculative. When investing, your capital is at risk
